
How Local Radar Apps Are Changing the Way Torontonians Track Weather
10 min read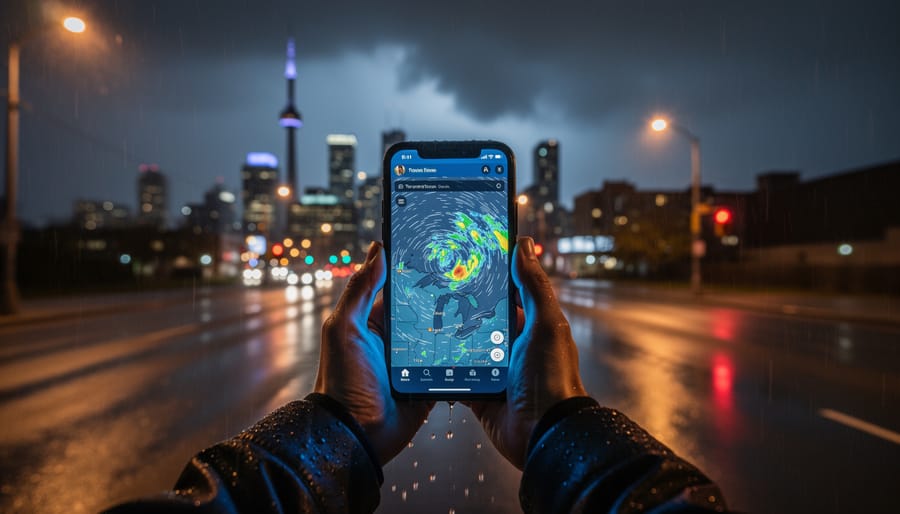
Local radar delivers real-time precipitation tracking and storm movement within a specific geographic area, enabling residents to monitor approaching weather systems minute by minute through satellite imagery and Doppler radar technology. For Toronto and surrounding communities, this technology has evolved from a specialized meteorological tool into an essential mobile service, with platforms like MyRadar accumulating over 50 million downloads and Environment Canada’s weather site providing hourly forecasts alongside dedicated radar imagery for Canadian locations.
The surge in local radar adoption reflects a fundamental shift in how communities prepare for weather events. Rather than relying solely on regional forecasts that may miss hyperlocal storm cells or sudden precipitation changes, users can now observe weather patterns as they develop across their neighborhoods. The ISCN Weather app, for instance, recently integrated the HRRR weather model and extends radar forecasts 18 hours into the future, offering both immediate situational awareness and advance planning capacity.
This convergence of navigational and informational needs defines the local radar landscape in 2026. Aviation Data Systems’ MyRadar demonstrates the navigational demand, displaying animated weather radar centered on a user’s current position with enough precision to inform decisions about outdoor activities, commutes, or event scheduling. Meanwhile, the informational dimension addresses how these platforms synthesize multiple data streams, translate complex meteorological observations into visual formats, and deliver that intelligence through interfaces accessible to non-specialists. Understanding both the technology’s mechanics and its practical applications clarifies why local radar has become standard equipment for weather-conscious residents across the Greater Toronto Area.
The Technology Behind Local Radar: What You’re Actually Seeing
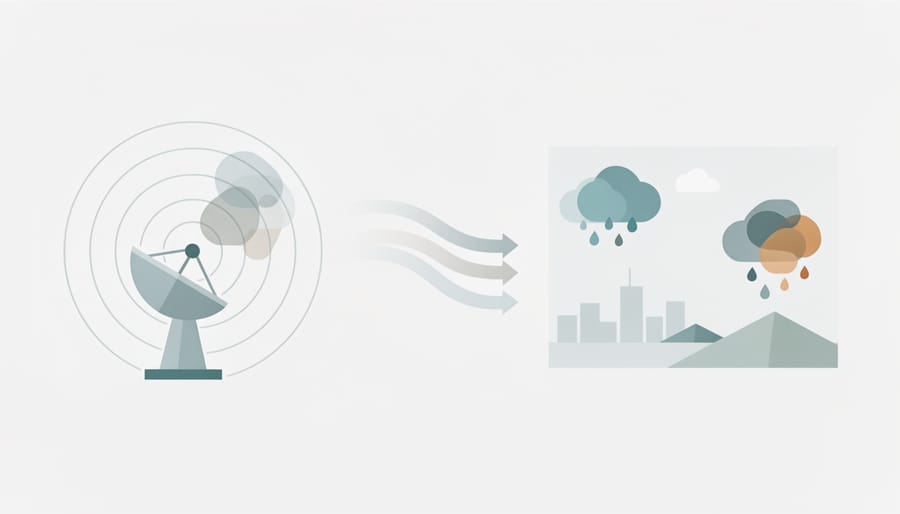
When you open a radar app on your phone, you’re looking at the output of ground-based weather radar stations that pulse electromagnetic energy into the atmosphere. These pulses bounce off precipitation particles, raindrops, snowflakes, hail, and return to the station, which measures the time delay and strength of the echo. The stronger the return signal, the heavier the precipitation. Apps like MyRadar, which has earned over 50 million downloads and 1.1 million App Store ratings, take this raw data and render it as animated, color-coded maps overlaid on your location.
The color gradient you see represents reflectivity intensity. Greens typically indicate light rain or drizzle, yellows and oranges show moderate precipitation, and reds or purples signal heavy rain or severe weather. These aren’t arbitrary: they correspond to measured decibel levels of radar reflectivity, translated into visual shorthand anyone can interpret at a glance. Environment Canada’s platform combines this radar imagery with satellite data and seven-day forecasts, giving users both the immediate picture and the broader context. More advanced apps like ISCN Weather now integrate the HRRR (High-Resolution Rapid Refresh) weather model, which can project future radar conditions out to 18 hours, essentially showing where precipitation will likely move before it arrives.
Understanding what radar actually measures helps clarify its strengths and limits:
- Reflectivity
- The intensity of the radar echo returning from precipitation particles, displayed as color-coded zones that indicate how much rain or snow is falling in a given area.
- Precipitation Type
- Radar alone cannot definitively distinguish rain from snow or freezing rain; algorithms estimate type based on reflectivity patterns and temperature data from other sources.
- Loop Animation
- A sequence of radar snapshots played in succession, revealing storm movement and allowing users to extrapolate when precipitation will reach their location.
- Echo Intensity
- Higher intensity (reds, purples) suggests larger or more numerous precipitation particles, often correlating with heavier rainfall or severe weather, though not directly measuring rainfall rate.
The real innovation lies in how these apps refresh every few minutes and center the display on your exact position. You’re not interpreting a static regional map from a morning forecast; you’re watching precipitation cells move across your neighborhood in near-real-time, letting you decide whether to leave now or wait 20 minutes for a band of rain to pass.
Why Torontonians Are Choosing Hyperlocal Over Traditional Forecasts
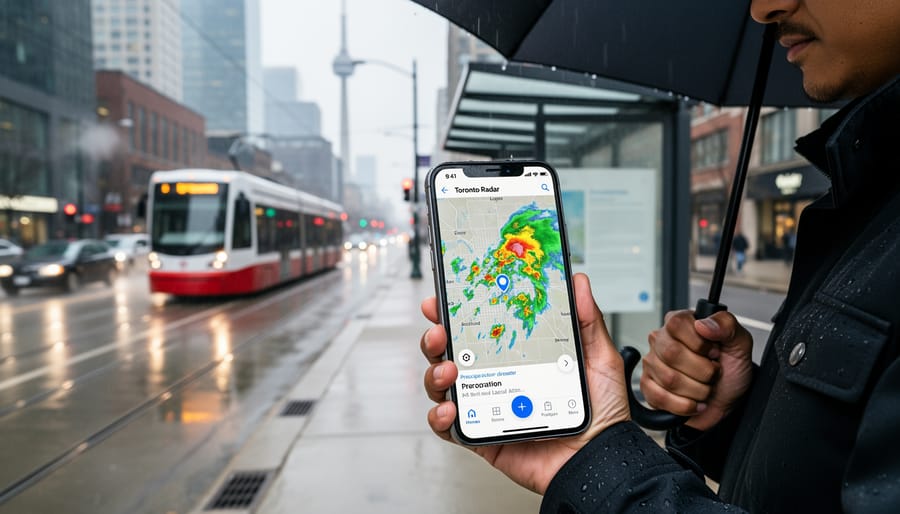
Toronto’s weather doesn’t respect city boundaries. A forecast calling for scattered showers across the GTA tells you precipitation will happen somewhere, but it won’t tell you whether your Leslieville commute stays dry while Liberty Village gets soaked, or whether the system stalling over the lake will dump rain in Scarborough while missing Etobicoke entirely. That gap between regional predictions and neighborhood reality drives the shift toward hyperlocal radar.
Lake Ontario creates its own weather patterns. When cold air moves across warmer lake water, it picks up moisture and dumps it inland, often concentrating precipitation in narrow bands that shift with wind direction. A city-wide forecast can’t capture these lake-effect variations, which can mean the difference between drizzle in one neighborhood and a downpour three kilometers away. Radar apps show you the actual precipitation echo moving across your specific location, not a generalized probability spread across the entire metro area.
Urban microclimates compound the challenge. Toronto’s downtown core runs several degrees warmer than surrounding areas, turning forecasted snow into rain in the Financial District while Vaughan sees accumulation. The Scarborough Bluffs face different wind patterns than the Humber Valley. Traditional forecasts average these conditions into a single prediction, effectively accurate nowhere. Radar cuts through that ambiguity by showing what’s falling where, right now.
The precision matters most when timing is everything. Commuters checking radar before leaving work can see whether the band of heavy rain will clear their route in fifteen minutes or persist for an hour. Outdoor workers frame houses and pour concrete on tight schedules; they need to know if the precipitation approaching from the west will hit their Mississauga site in twenty minutes or skip north toward Brampton. Event planners setting up for a Harbourfront concert can watch the system’s movement and make real-time calls about delaying setup rather than relying on a forecast issued six hours earlier.
The appeal isn’t novelty. It’s control over decisions that city-wide predictions leave to guesswork, delivered through a visual interface that requires no meteorological training to interpret.
The Apps Torontonians Are Using: Features That Matter
Three platforms dominate the local radar landscape for Toronto users, each offering distinct capabilities that address different aspects of weather tracking. Understanding what each app actually delivers, and where they differ, helps residents choose the tool that matches their specific needs.
MyRadar, developed by Aviation Data Systems, Inc., has established itself as the most widely adopted option with over 50 million downloads and 1.1 million ratings in the App Store. The app displays animated weather radar around your current location, providing a straightforward visual interface that updates continuously. Its strength lies in simplicity: open the app, see precipitation patterns moving across your area, and make immediate decisions. The platform’s high-resolution radar animations cover the entire Greater Toronto Area, and users can zoom out to track systems approaching from Lake Ontario or further afield.
Environment Canada’s official weather platform integrates radar and satellite imagery with comprehensive seven-day forecasts, creating a one-stop resource for both immediate and planning horizons. This government-operated service provides the latest hourly forecasts for locations across Canada alongside local radar views, giving Toronto users the advantage of data from the same source that meteorologists rely on. The dual presentation of radar and satellite imagery offers context that single-view apps miss, you can see cloud formations developing over the lake before they produce precipitation on radar.
The ISCN Weather app brings advanced meteorological modeling to consumer devices through its implementation of the HRRR (High-Resolution Rapid Refresh) weather model. This platform can show future radar forecasts out to 18 hours, extending beyond the typical nowcasting window that most radar apps limit themselves to. For Toronto users planning outdoor activities or managing weather-sensitive operations, this extended forecast horizon bridges the gap between real-time radar and traditional daily forecasts.
| Feature | MyRadar | Environment Canada | ISCN Weather |
|---|---|---|---|
| Radar Range | Current location animated radar | National radar + satellite | HRRR model-based |
| Forecast Horizon | Nowcast (0-2 hours) | 7-day forecasts + hourly | 18-hour future radar |
| Canadian Coverage | Full GTA coverage | Complete national coverage | Model-dependent coverage |
The practical differences emerge in daily use. MyRadar excels when you need a quick answer to “is it raining near me right now?” Environment Canada suits users who want comprehensive weather information from a single trusted source, particularly those planning days ahead. ISCN Weather serves the middle ground, offering predictive radar that shows where precipitation will likely develop over the next half-day, useful for scheduling outdoor work or events with more lead time than nowcasting provides but more precision than daily forecasts.
From Radar to Decision: Practical Applications in Daily Life
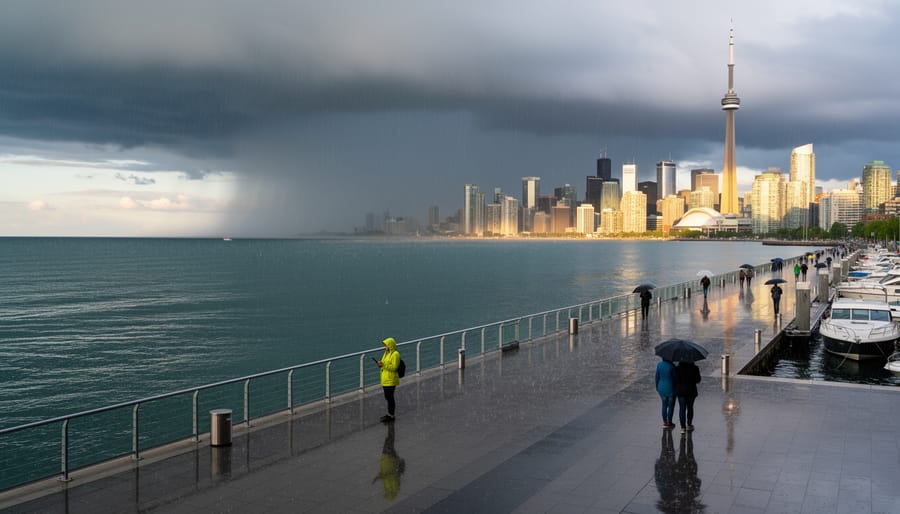
Toronto commuters have turned radar checks into reflex. A construction manager in Etobicoke glances at precipitation movement before scheduling a concrete pour. An event coordinator in High Park watches the radar loop 30 minutes before setup, deciding whether to deploy canopy tents or proceed with an open layout. These aren’t hypothetical scenarios, they’re daily decisions now informed by data that was once confined to meteorology offices.
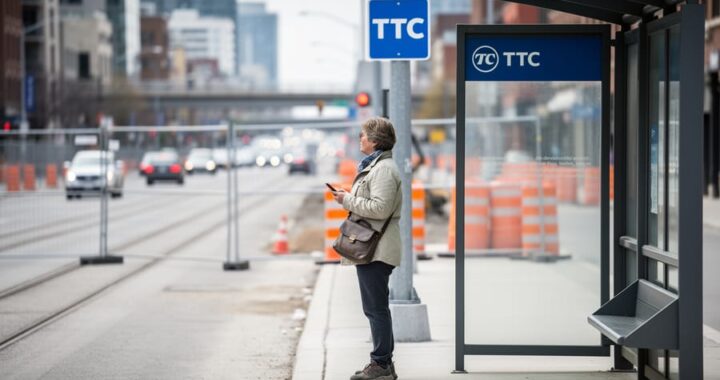
The most immediate application plays out during rush hour. Drivers leaving downtown check whether that band of moderate rain will clear the Gardiner in 20 minutes or linger for the next hour, often cross-referencing radar with live traffic alerts to avoid compounded delays. Transit users time their walk to the station around precipitation gaps, particularly valuable when coordinating connections around TTC closures that eliminate backup route flexibility. The behavioral shift isn’t about avoiding rain entirely but optimizing exposure, leaving five minutes later to miss the heaviest cell rather than arriving drenched or excessively early.
Outdoor industries have integrated radar into operational workflows. Landscaping crews in Vaughan and Markham monitor approaching systems to decide whether to start jobs requiring dry conditions or pivot to tasks unaffected by moisture. Film production assistants track radar during location shoots, calling holds when reflectivity suggests equipment-damaging downpours within the next 30 minutes. Even agricultural operations in the Holland Marsh use radar to time fieldwork windows between systems, though they still rely on comprehensive forecasts for longer-term irrigation and planting decisions.
Emergency preparedness represents the highest-stakes application. Residents in flood-prone areas near the Don and Humber rivers watch radar intensity during severe weather warnings, gauging whether to move vehicles or prepare basements. Combined with health safety tips during extreme weather events, radar apps provide the immediate situational awareness that static forecasts can’t match, showing not just that severe weather is possible, but where it currently sits relative to your exact location.
Accuracy Versus Convenience: What Local Radar Can’t Tell You
Radar apps excel at showing precipitation, where it is, how intense it appears, and which direction it’s moving. But that colourful animation doesn’t tell you whether the temperature will drop below freezing, how strong the wind will be, or if those bright red patches represent hail, freezing rain, or simply heavy downpours. Radar measures reflectivity, the energy bouncing back from precipitation particles, not the particles themselves. That’s why a winter storm and a summer thunderstorm can produce similar radar signatures despite wildly different ground conditions.
The convenience of glancing at your phone to see a rain band approaching comes with interpretive limits. Many users assume radar predicts exact arrival times, but atmospheric conditions shift constantly; that blob of green might evaporate before reaching you, or intensify unexpectedly. Future radar projections, like the ISCN Weather app’s 18-hour forecasts, model probable movement based on current patterns, not guaranteed outcomes. They’re educated extrapolations, not certainties.
This is where reliable tools complement each other rather than compete. Radar answers “what’s happening right now in my immediate area,” while comprehensive forecasts from meteorologists provide context, temperature trends, wind speeds, humidity, storm severity indices, and multi-day outlooks. Torontonians who rely solely on radar miss crucial information: that approaching system might bring lightning dangerous to outdoor workers, or freezing conditions that turn wet roads into ice rinks. The most weather-savvy users treat radar as one input among several, checking radar for tactical timing decisions while consulting full forecasts for strategic planning and safety.
Local radar has shifted from a niche weather-tracking tool to a daily reference point for hundreds of thousands of Torontonians. The numbers tell part of the story, MyRadar’s 50 million downloads and 1.1 million App Store ratings reflect widespread adoption, but the behavioral change runs deeper. People now check radar loops before leaving for work, scan precipitation patterns during outdoor events, and make granular decisions based on what’s moving toward their specific neighborhood in the next twenty minutes. This isn’t a passing fascination with weather technology. It’s a practical response to Toronto’s microclimate variability and the inadequacy of broad regional forecasts for immediate planning.
What makes this shift sustainable is how seamlessly radar apps have integrated into existing routines. They require no specialized knowledge, cost nothing to access in their basic forms, and deliver actionable information faster than traditional forecast models. The technology democratizes meteorological data that once required professional interpretation, putting real-time precipitation tracking in everyone’s pocket. For a city shaped by lake-effect storms, sudden temperature swings, and hyper-local weather patterns, that accessibility matters. Local radar hasn’t replaced comprehensive forecasting, it complements it by filling the gap between what might happen later and what’s happening right now. Toronto’s weather culture has absorbed this tool not as a novelty, but as infrastructure.